Diffusion within a Single Phase: Uniform Initial Compositions
Purpose: Learn to perform diffusion simulation at constant temperature for a diffusion couple with both sides having the same single phase structure and uniform composition through each side before diffusion.
Module: PanDiffusion
Thermodynamic and Mobility Database: FeCrNi.tdb
Batch file: Example_#4.1.pbfx
Calculation Procedures:
-
Create a workspace and select the PanDiffusion module following Pandat User's Guide: Workspace;
-
Load FeCrNi.tdb following the procedure in Pandat User's Guide: Load Database , and select all three components;
-
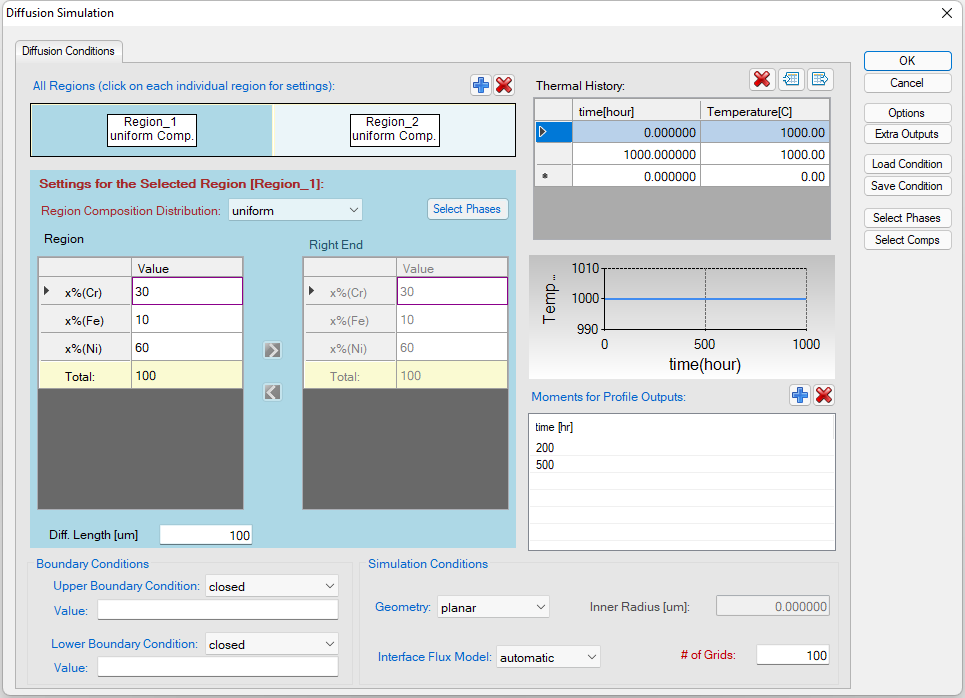
Click on the menu "PanDiffusion → Diffusion Simulation" and set up the calculation condition as shown in Figure 1. First select "Region Composition Distribution" as Uniform, which means that composition in each region is uniform before diffusion. Click on Region_1 and set the composition of the left side of the diffusion couple as 30Cr-10Fe-60Ni (at%), then click on Region_2 and set the composition of the right side of the diffusion couple as 10Cr-20Fe-70Ni (at%) (which is not shown in Figure 1).
-
The length of both Region_1 and Region_2 is set to be 100 mm, and the total number of grids (# of Grids) is 100.
-
The Thermal History is holding the diffusion couple at 1000 °C for 1000 hours.
-
The default output includes composition profiles of the initial and final stages. Composition profiles can also be plotted and listed in the table for intermediate times. By clicking the blue “+” next to the “Moments for Profile Outputs” composition profiles for number of intermediate stages can be outputted. As shown in Figure 1, those at 200 hour and 500 hour will be outputted. Click OK to start calculation.
-
User can define the "Geometry" as "Planar, Cylindrical, and Spherical";
-
User can also select "Interface Flux Model" and set "boundary conditions". Details on these options can be found in Pandat User's Guide: Settings in General Diffusion Simulation .
Post Calculation Operation:
-
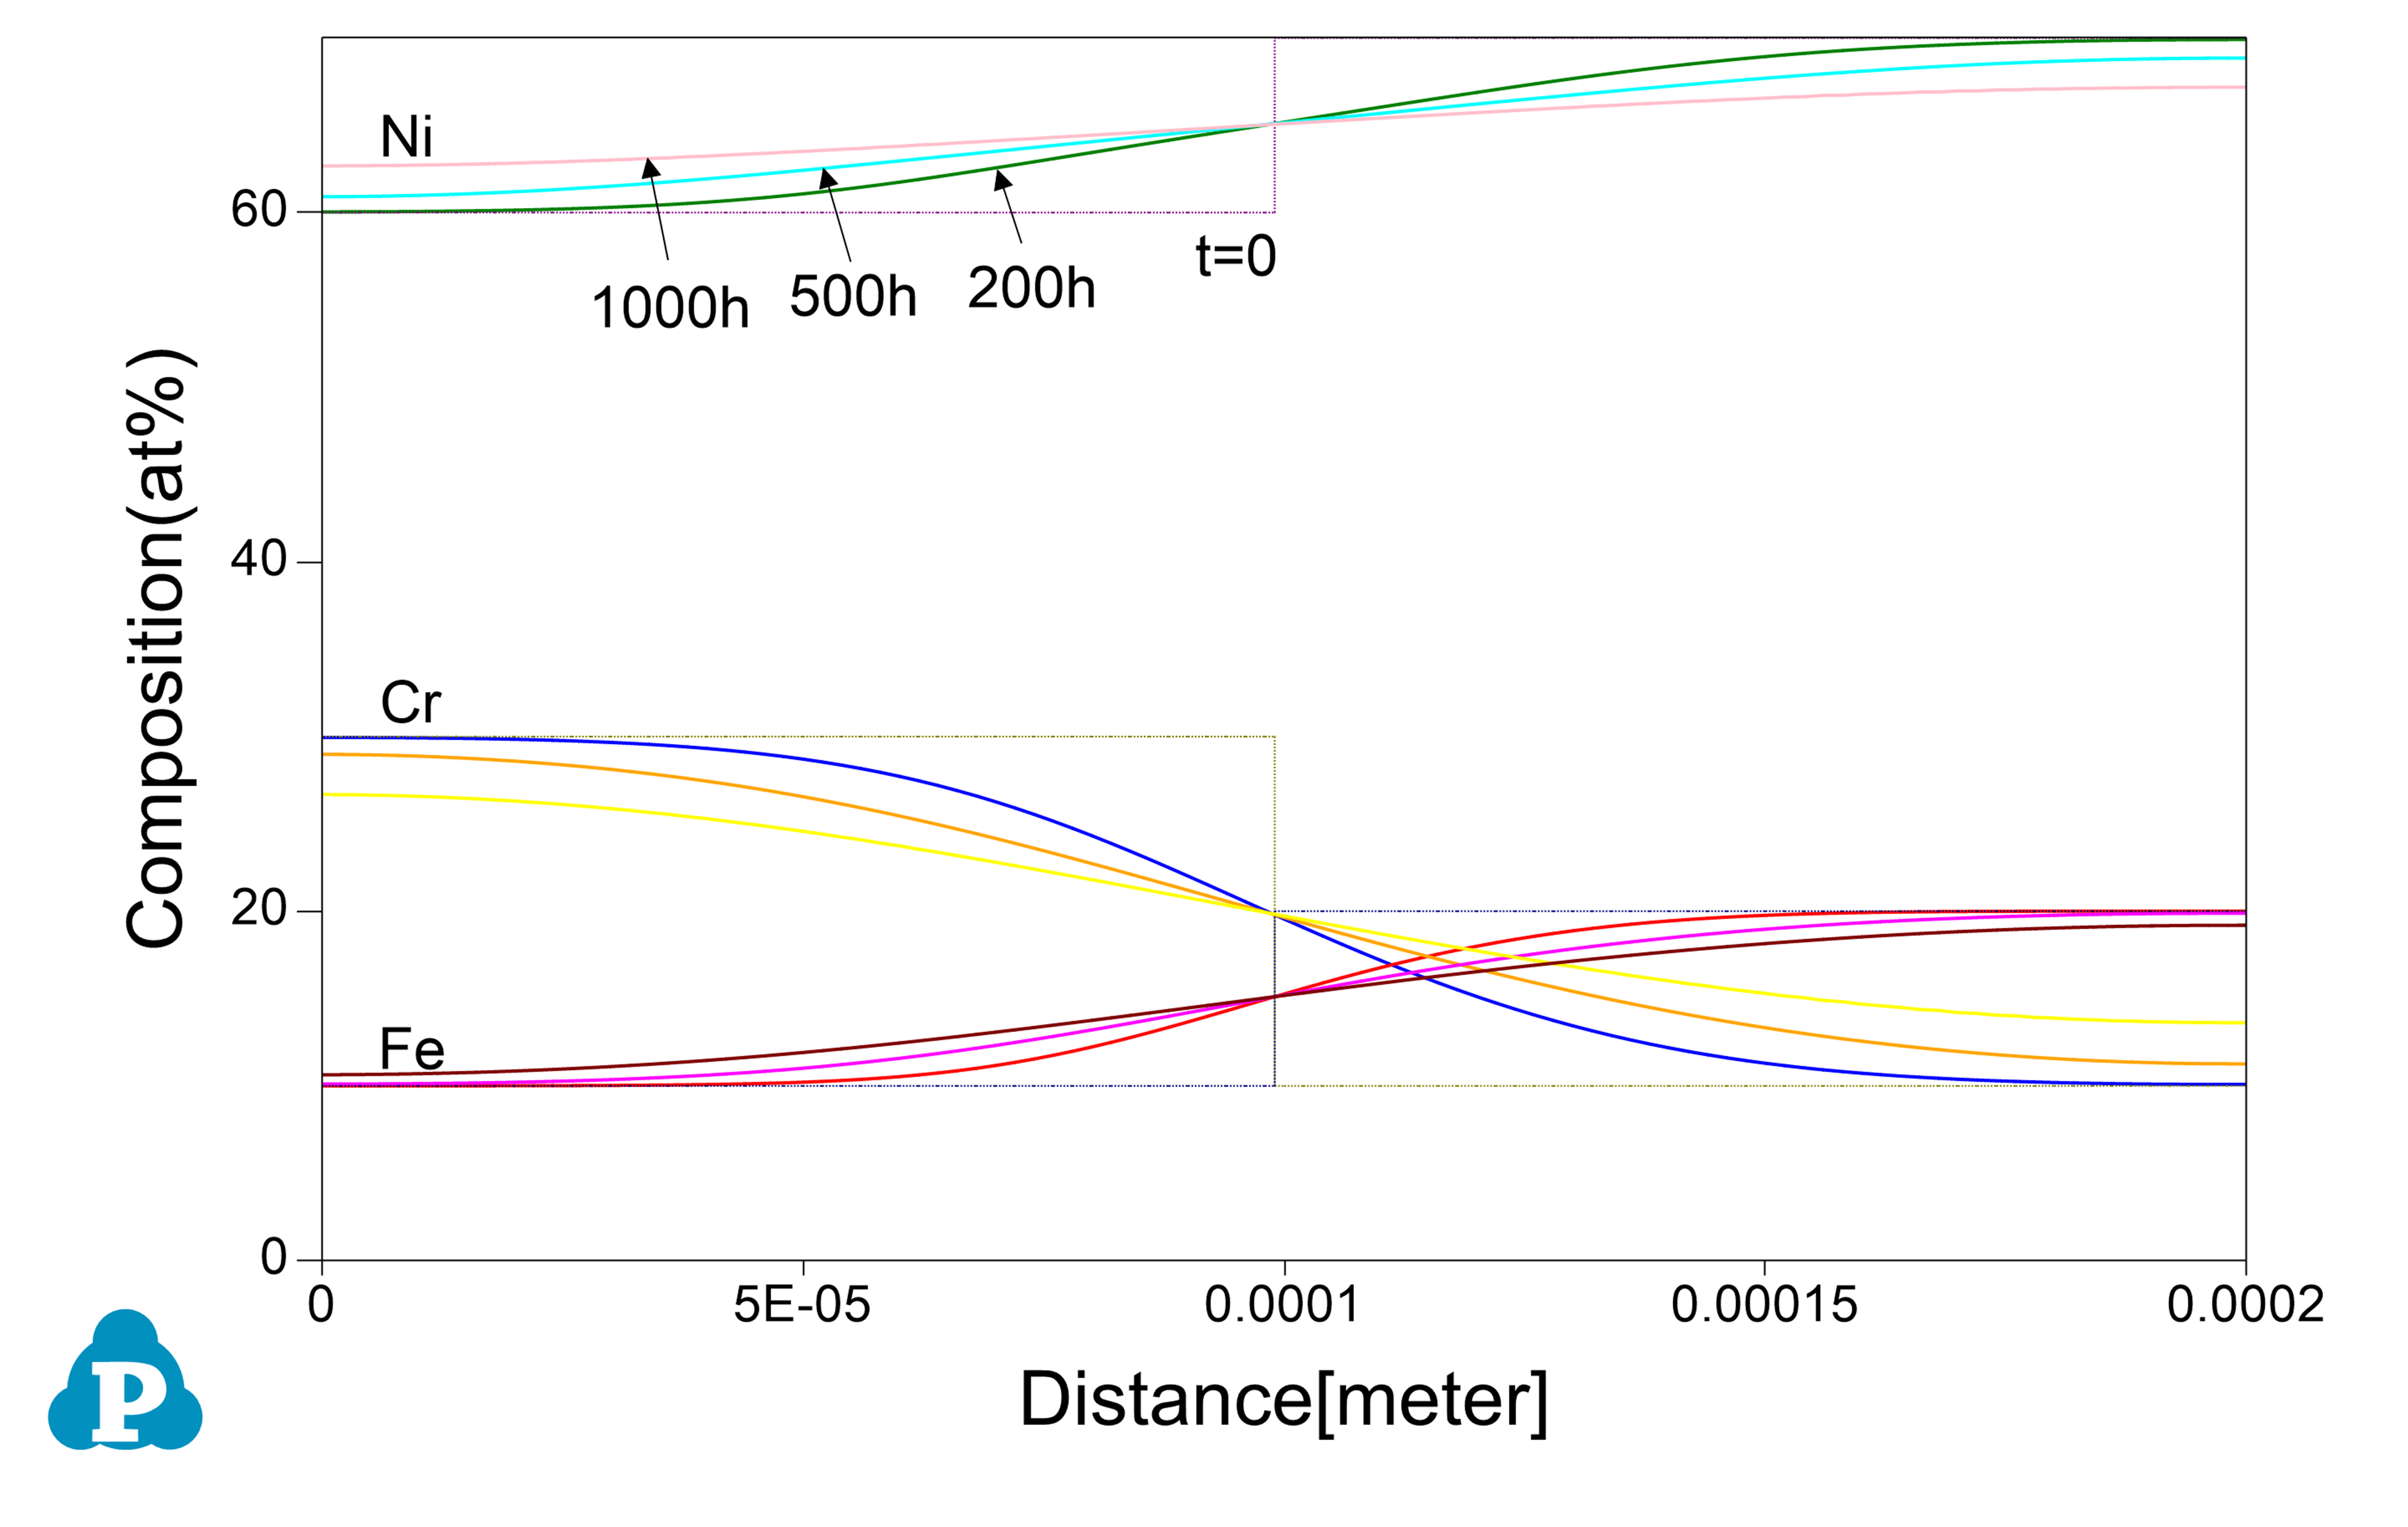
Change graph appearance and add text following the procedure in Pandat User's Guide: Property. The calculated plot is show in Figure 2
-
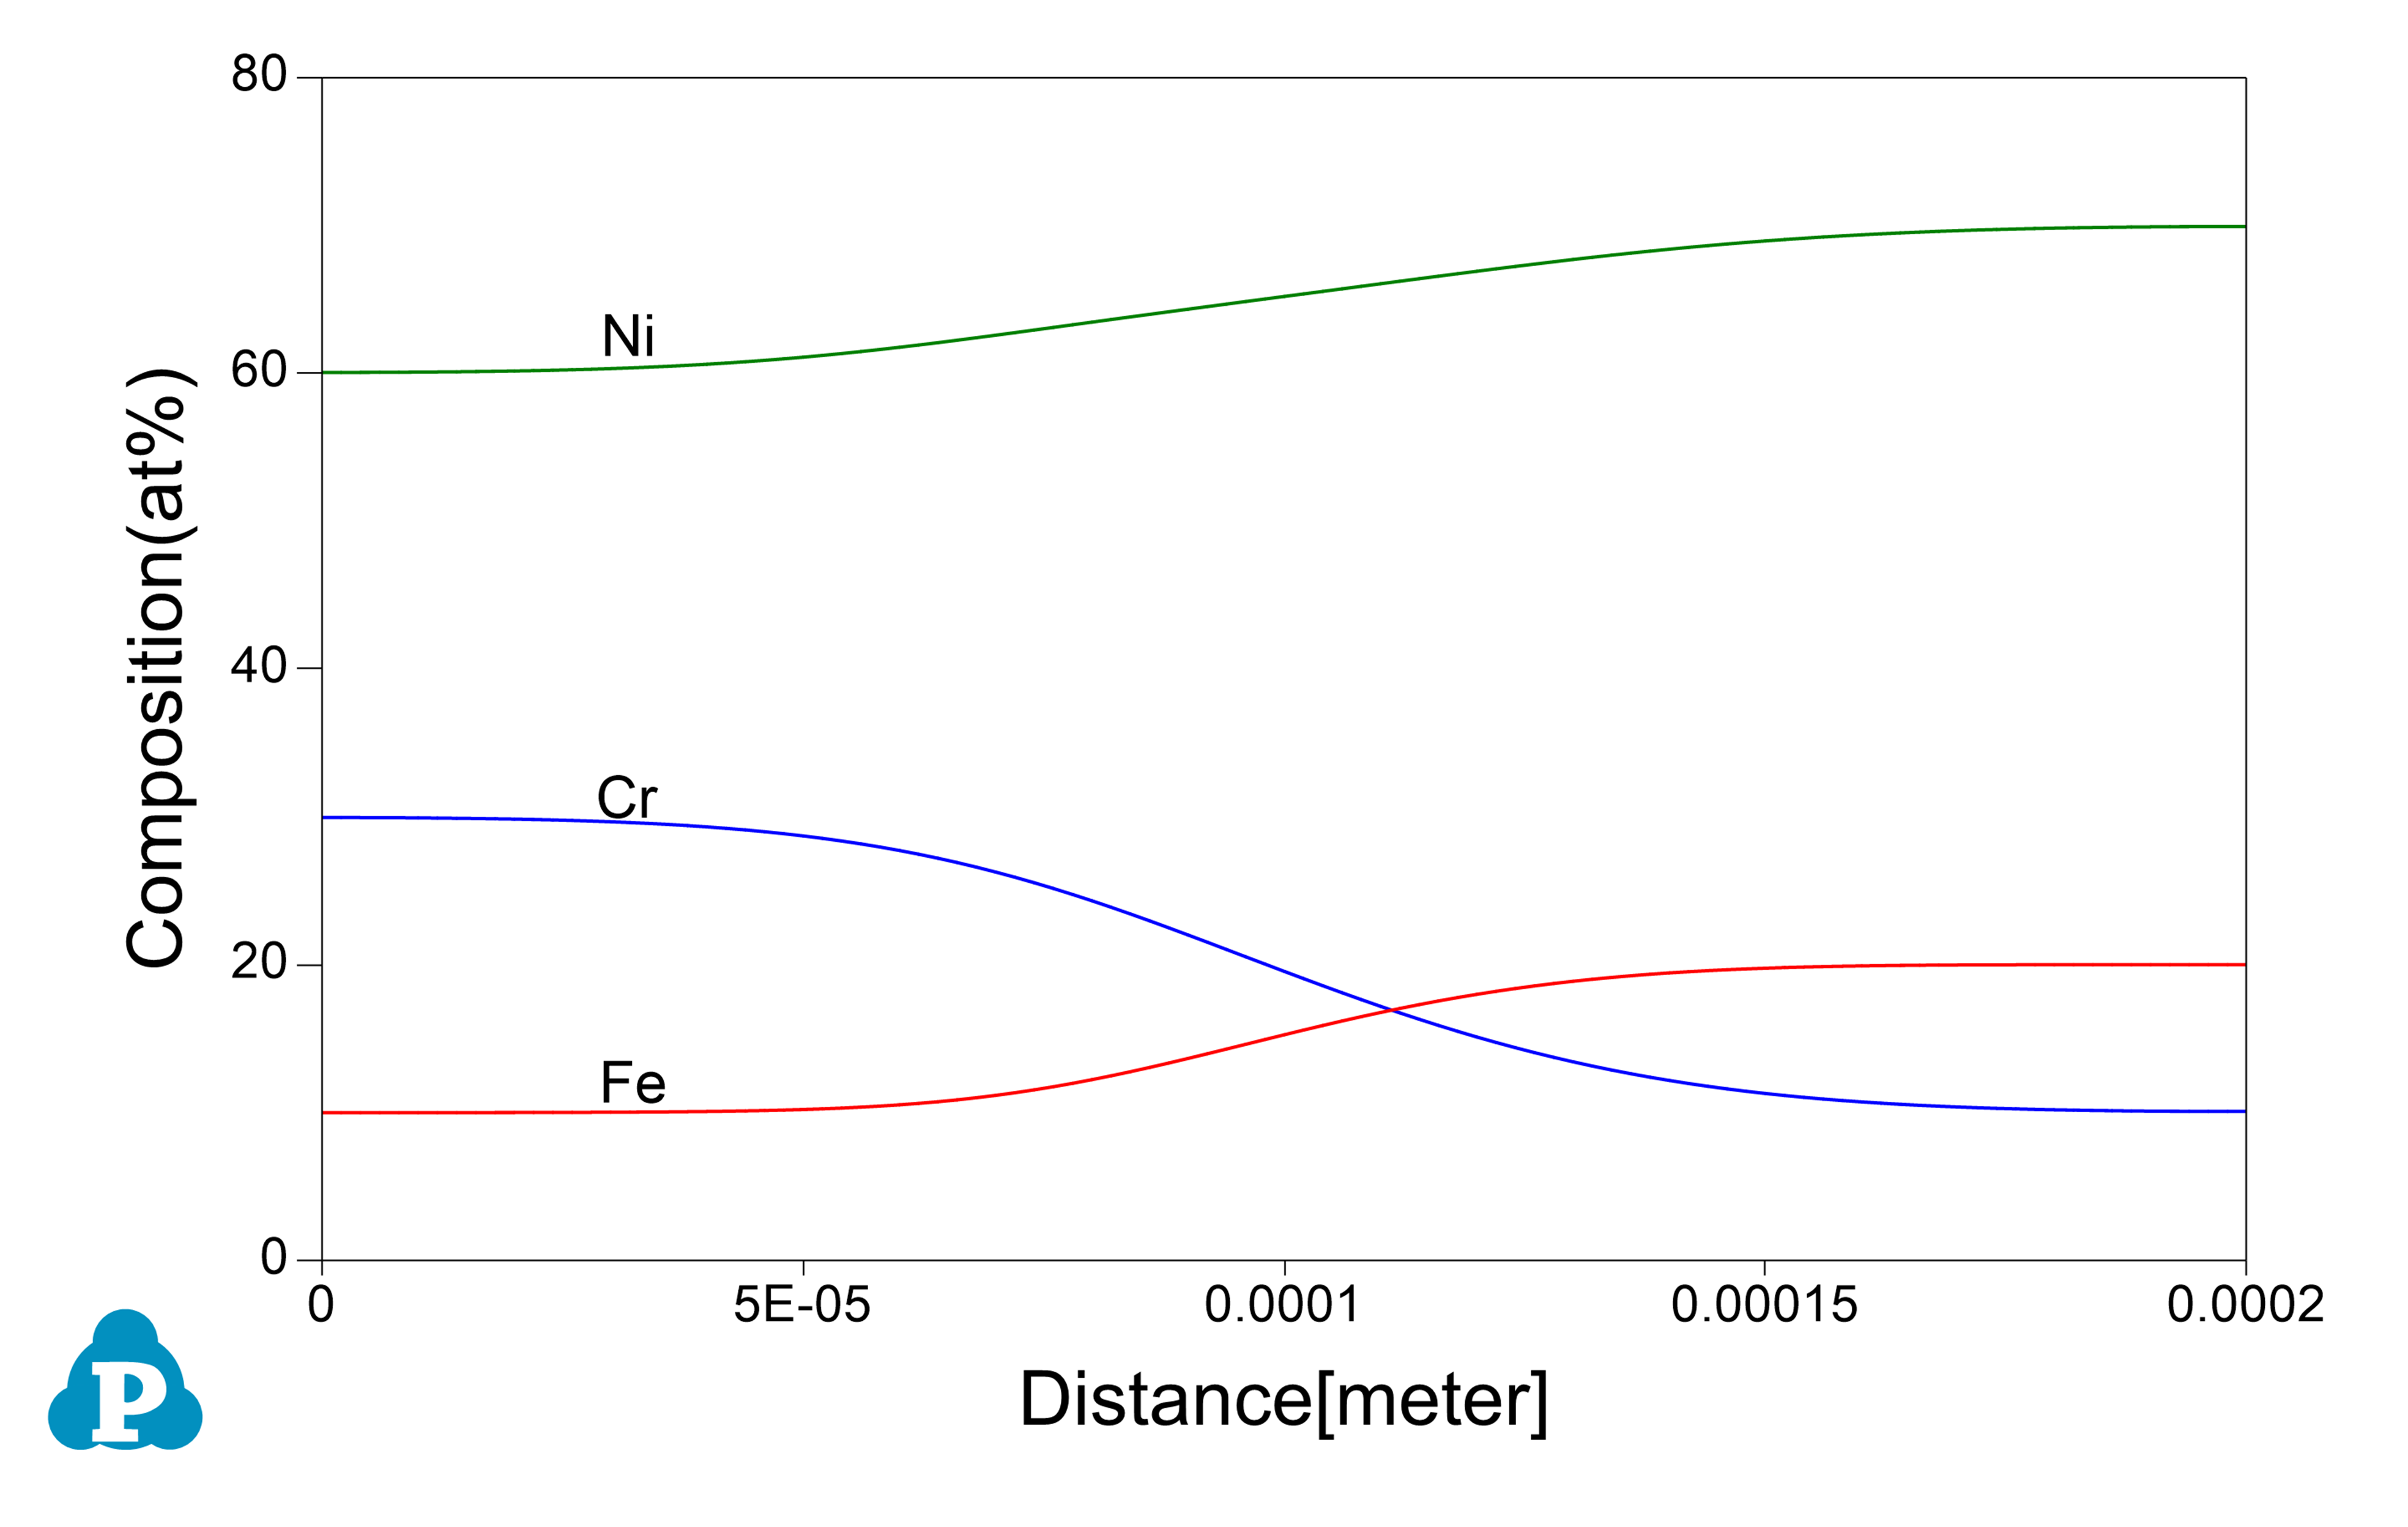
In addition to Default table, composition profiles at selected times are given in separated tables under Table, which can be plotted separately as shown in Figure 3.
Information obtained from this calculation:
-
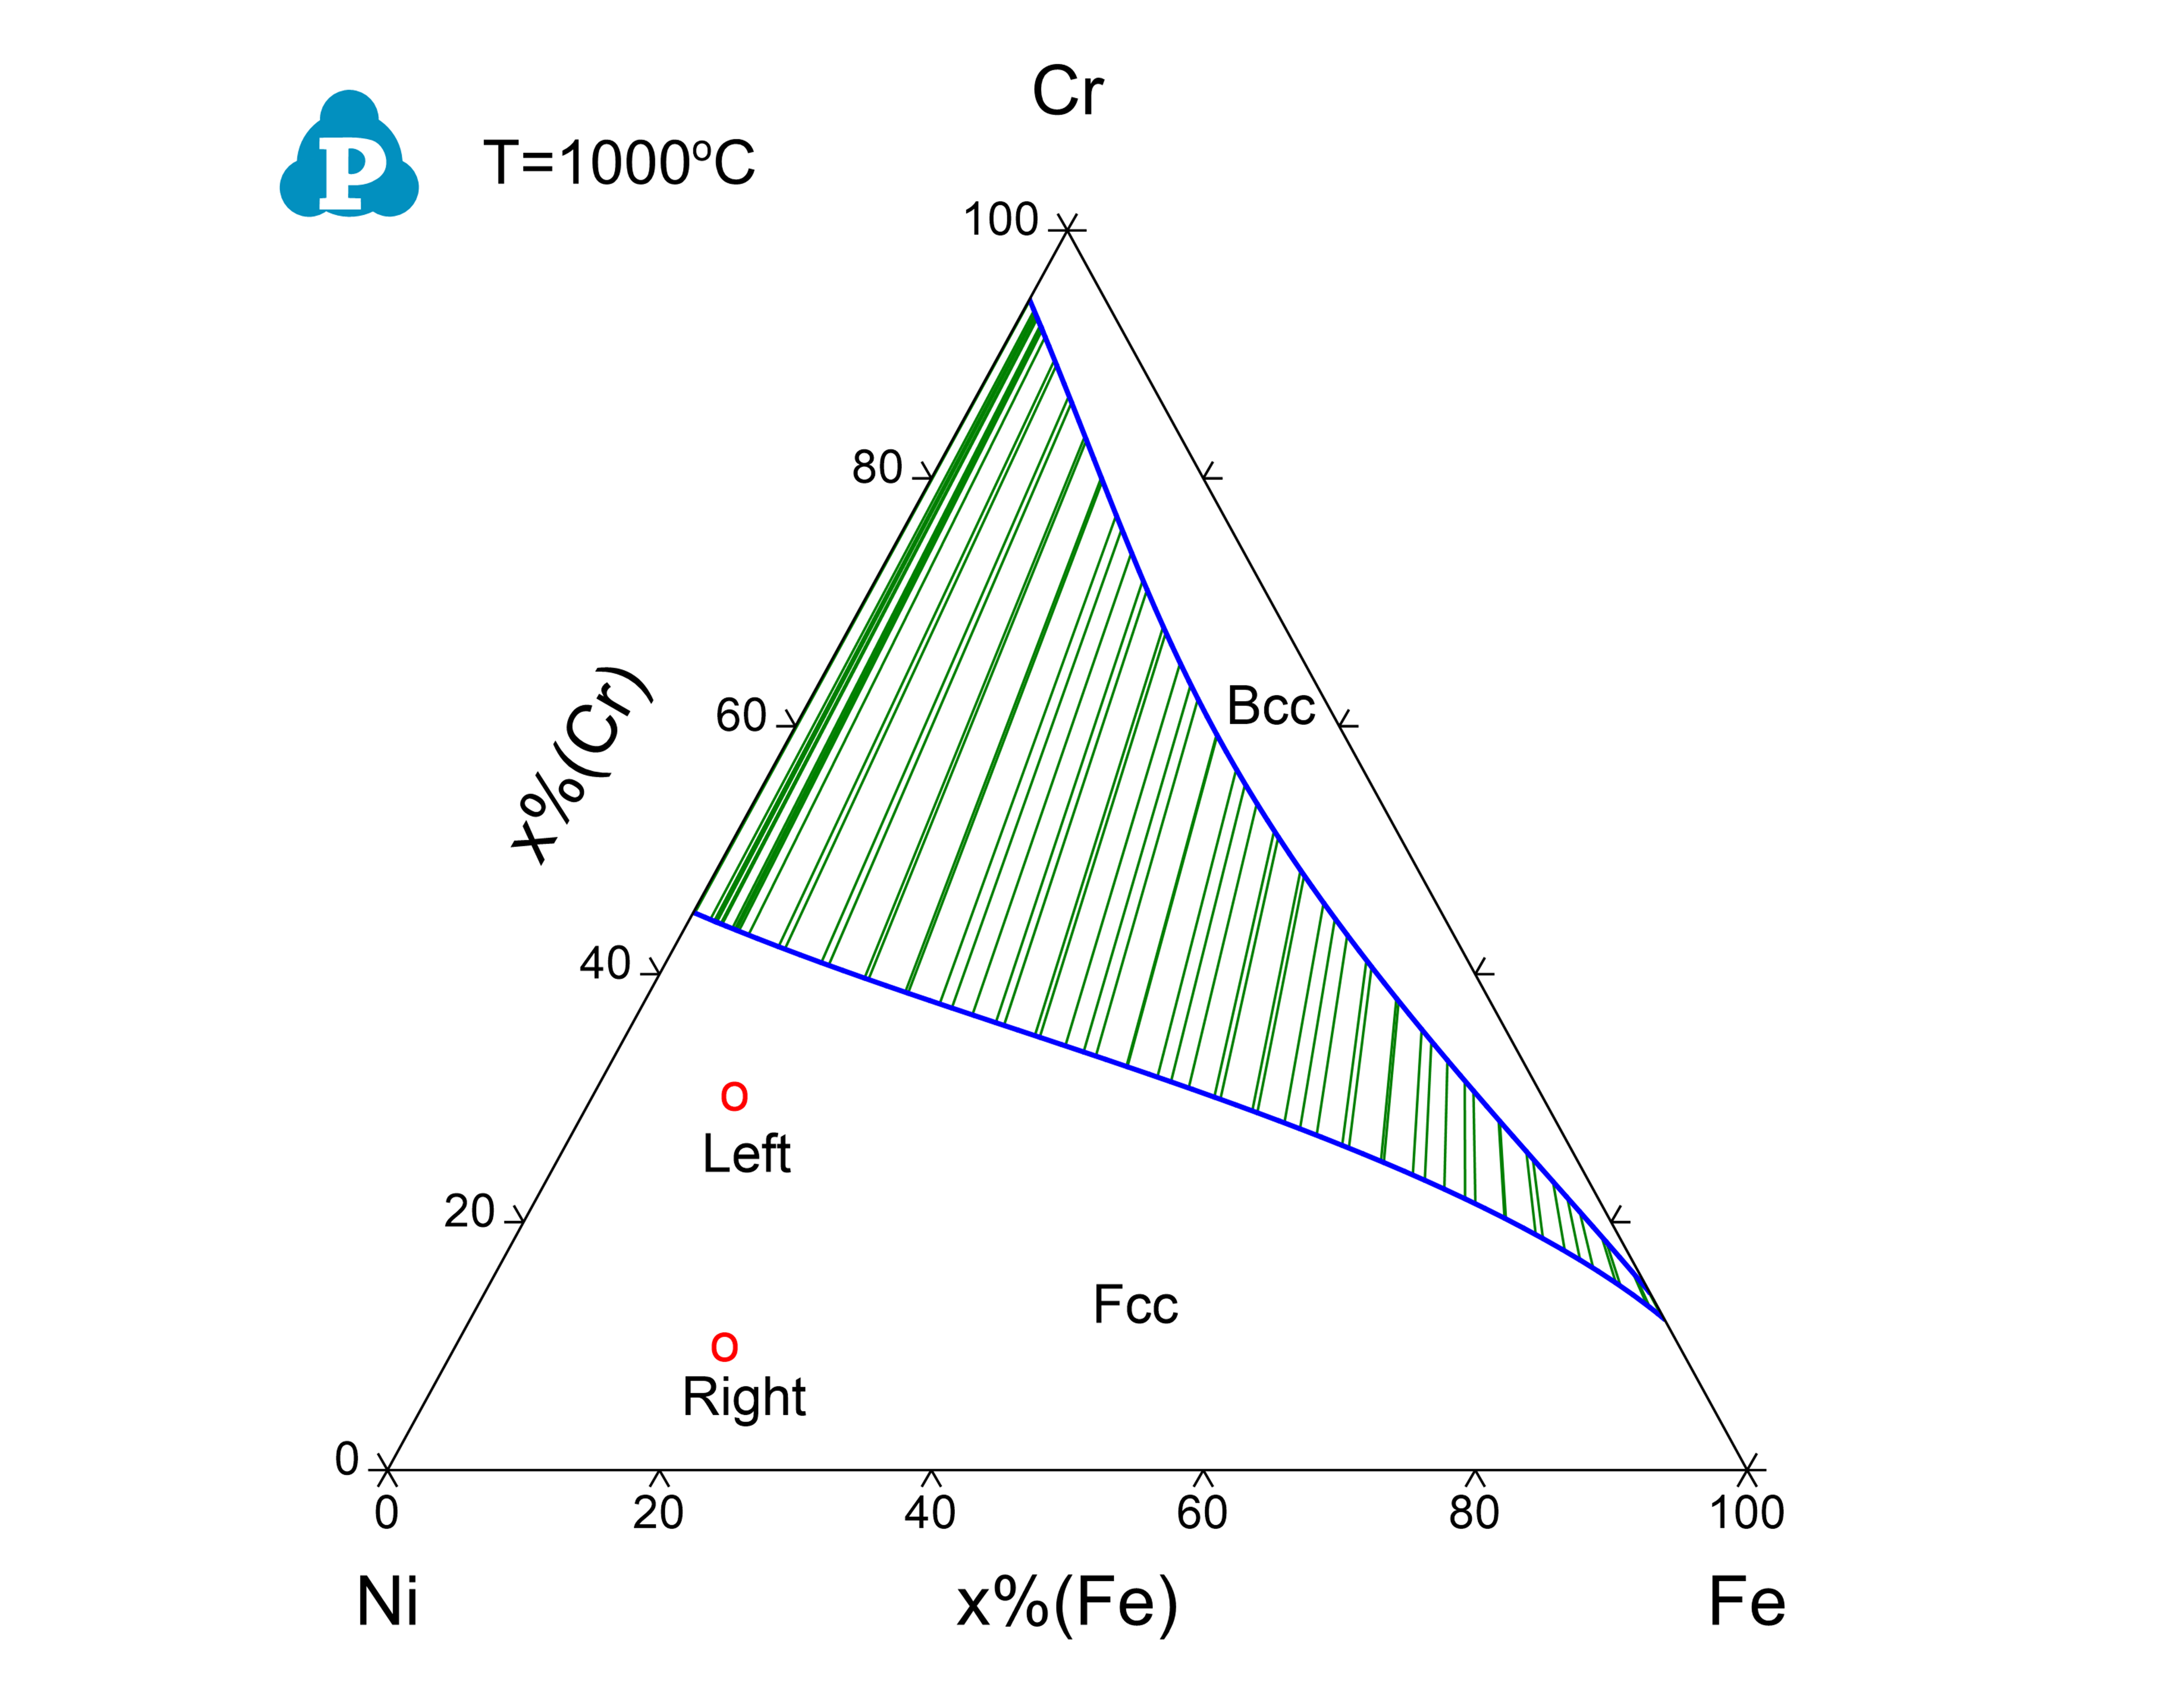
In this example, the initial compositions of the two regions of the diffusion couple are both in the single Fcc phase field as shown in the isotherm of Fe-Cr-Ni at 1000°C in Figure 4;
-
Composition profiles at selected times can be obtained.